Stock Trend Analysis Report
Prepared for you on Thursday, May 9, 2024.
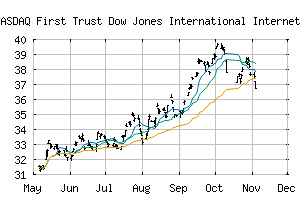
First Trust Dow Jones International Internet ETF (NASDAQ:FDNI)
Countertrend Up (+85) - FDNI is showing short-term weakness. However, look for the longer-term bullish trend to resume. As always, continue to monitor the trend score and utilize a stop order.
Is it time to buy, sell, or avoid FDNI?
MarketClub looks at technical strength and momentum to determine if the timing is right for FDNI.
Learn more about the Trade Triangles and how we make technical analysis as easy as buy and sell.
|
|||||||||||||||
|
|||||||||||||||
MarketClub’s Trade Triangles for FDNI
![]() The long-term trend has been UP since Dec 15th, 2023 at 22.783
The long-term trend has been UP since Dec 15th, 2023 at 22.783
![]() The intermediate-term trend has been UP since Apr 23rd, 2024 at 23.236
The intermediate-term trend has been UP since Apr 23rd, 2024 at 23.236
![]() The short-term trend has been DOWN since May 8th, 2024 at 24.645
The short-term trend has been DOWN since May 8th, 2024 at 24.645
Smart Scan Analysis for FDNI
Based on our trend formula, FDNI is rated as a +85 on a scale from -100 (Strong Downtrend) to +100 (Strong Uptrend).
| Open | High | Low | Price | Change |
|---|---|---|---|---|
| 24.520 | 24.524 | 23.974 | 24.122 | -0.633 |
| Prev. Close | Volume | Bid | Ask | Time |
| 24.080 | 0 | 2024-05-08 16:29:09 |
| Year High | 20.1641 | Year High Date | 2018-11-07 |
| Year Low | 18.39 | Year Low Date | 2018-11-12 |
| 52wk High | 25.4529 | 52wk High Date | 2023-07-31 |
| 52wk Low | 19.115 | 52wk Low Date | 2023-11-01 |
| Average Volume | 4,099 | Shares Outstanding | 100 |
| Market Cap | 4M |