Stock Trend Analysis Report
Prepared for you on Thursday, May 9, 2024.
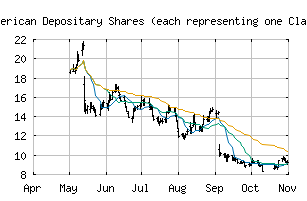
Endava plc American Depositary Shares (each representing one Class A Ordinary Share) (NYSE:DAVA)
Crossroads (+60) - DAVA is struggling to move into a solid trend. Beware of choppy markets and consider a sidelines position until a stronger trend is identified.
Is it time to buy, sell, or avoid DAVA?
MarketClub looks at technical strength and momentum to determine if the timing is right for DAVA.
Learn more about the Trade Triangles and how we make technical analysis as easy as buy and sell.
|
|||||||||||||||
|
|||||||||||||||
MarketClub’s Trade Triangles for DAVA
![]() The long-term trend has been DOWN since Feb 29th, 2024 at 47.7900
The long-term trend has been DOWN since Feb 29th, 2024 at 47.7900
![]() The intermediate-term trend has been UP since May 6th, 2024 at 31.8648
The intermediate-term trend has been UP since May 6th, 2024 at 31.8648
![]() The short-term trend has been UP since May 1st, 2024 at 30.3000
The short-term trend has been UP since May 1st, 2024 at 30.3000
Smart Scan Analysis for DAVA
Based on our trend formula, DAVA is rated as a +60 on a scale from -100 (Strong Downtrend) to +100 (Strong Uptrend).
| Open | High | Low | Price | Change |
|---|---|---|---|---|
| 32.60 | 32.70 | 31.33 | 31.65 | -1.52 |
| Prev. Close | Volume | Bid | Ask | Time |
| 33.17 | 809824 | 2024-05-09 12:38:37 |
| Year High | 31.5 | Year High Date | 2018-10-02 |
| Year Low | 21.13 | Year Low Date | 2018-10-11 |
| 52wk High | 81.06 | 52wk High Date | 2024-01-22 |
| 52wk Low | 28.99 | 52wk Low Date | 2024-04-30 |
| Average Volume | 577,224 | Market Cap | 2,053M |
| Assets | 708,126,000M | Liabilities | 197,663,000M |
| P/E Ratio | 35.6615 | Volatility | 40.29 |