Stock Trend Analysis Report
Prepared for you on Thursday, May 9, 2024.
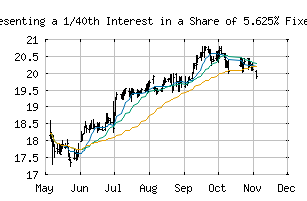
Synchrony Financial Depositary Shares, each Representing a 1/40th Interest in a Share of 5.625% Fixed Rate Non-Cumulative Perpetual Preferred Stock, Series A (NYSE:SYF.PR.A)
Countertrend Up (+85) - SYF.PR.A is showing short-term weakness. However, look for the longer-term bullish trend to resume. As always, continue to monitor the trend score and utilize a stop order.
Is it time to buy, sell, or avoid SYF.PR.A?
MarketClub looks at technical strength and momentum to determine if the timing is right for SYF.PR.A.
Learn more about the Trade Triangles and how we make technical analysis as easy as buy and sell.
|
|||||||||||||||
|
|||||||||||||||
MarketClub’s Trade Triangles for SYF.PR.A
![]() The long-term trend has been UP since Dec 1st, 2023 at 16.7699
The long-term trend has been UP since Dec 1st, 2023 at 16.7699
![]() The intermediate-term trend has been UP since May 6th, 2024 at 18.3600
The intermediate-term trend has been UP since May 6th, 2024 at 18.3600
![]() The short-term trend has been DOWN since May 8th, 2024 at 18.1000
The short-term trend has been DOWN since May 8th, 2024 at 18.1000
Smart Scan Analysis for SYF.PR.A
Based on our trend formula, SYF.PR.A is rated as a +85 on a scale from -100 (Strong Downtrend) to +100 (Strong Uptrend).
| Open | High | Low | Price | Change |
|---|---|---|---|---|
| 18.1500 | 18.2699 | 17.9000 | 17.9500 | -0.3000 |
| Prev. Close | Volume | Bid | Ask | Time |
| 18.0700 | 46883 | 2024-05-08 14:57:43 |
| 52wk High | 20.03 | 52wk High Date | 2024-03-21 |
| 52wk Low | 14.5125 | 52wk Low Date | 2023-10-31 |
| Average Volume | 58,952 | Assets | 121,173,000M |
| Liabilities | 105,891,000M |