Stock Trend Analysis Report
Prepared for you on Thursday, May 9, 2024.
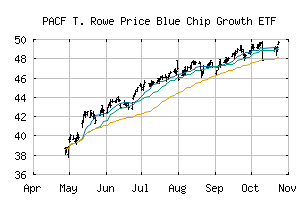
T. Rowe Price Blue Chip Growth ETF (PACF:TCHP)
Strong Uptrend (+100) - TCHP is in a strong uptrend that is likely to continue. With short-term, intermediate, and long-term bullish momentum, TCHP continues to climb. Traders should protect gains and look for a change in score to suggest a slow down in momentum.
Is it time to buy, sell, or avoid TCHP?
MarketClub looks at technical strength and momentum to determine if the timing is right for TCHP.
Learn more about the Trade Triangles and how we make technical analysis as easy as buy and sell.
|
|||||||||||||||
|
|||||||||||||||
MarketClub’s Trade Triangles for TCHP
![]() The long-term trend has been UP since Nov 10th, 2023 at 28.87
The long-term trend has been UP since Nov 10th, 2023 at 28.87
![]() The intermediate-term trend has been UP since May 6th, 2024 at 35.37
The intermediate-term trend has been UP since May 6th, 2024 at 35.37
![]() The short-term trend has been UP since May 3rd, 2024 at 34.60
The short-term trend has been UP since May 3rd, 2024 at 34.60
Smart Scan Analysis for TCHP
Based on our trend formula, TCHP is rated as a +100 on a scale from -100 (Strong Downtrend) to +100 (Strong Uptrend).
| Open | High | Low | Price | Change |
|---|---|---|---|---|
| 35.2600 | 35.4533 | 35.2600 | 35.4100 | -0.0600 |
| Prev. Close | Volume | Bid | Ask | Time |
| 35.4200 | 103793 | 2024-05-08 15:59:17 |
| 52wk High | 35.82 | 52wk High Date | 2024-03-21 |
| 52wk Low | 24.65 | 52wk Low Date | 2023-05-09 |
| Average Volume | 76,931 |