Stock Trend Analysis Report
Prepared for you on Thursday, May 9, 2024.
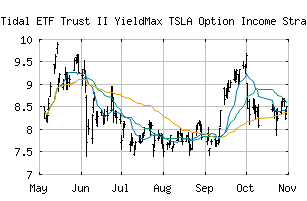
Tidal ETF Trust II YieldMax TSLA Option Income Strategy ETF (PACF:TSLY)
Countertrend Up (+85) - TSLY is showing short-term weakness. However, look for the longer-term bullish trend to resume. As always, continue to monitor the trend score and utilize a stop order.
Is it time to buy, sell, or avoid TSLY?
MarketClub looks at technical strength and momentum to determine if the timing is right for TSLY.
Learn more about the Trade Triangles and how we make technical analysis as easy as buy and sell.
|
|||||||||||||||
|
|||||||||||||||
MarketClub’s Trade Triangles for TSLY
![]() The long-term trend has been UP since Feb 26th, 2024 at 12.5059
The long-term trend has been UP since Feb 26th, 2024 at 12.5059
![]() The intermediate-term trend has been UP since Apr 29th, 2024 at 15.5900
The intermediate-term trend has been UP since Apr 29th, 2024 at 15.5900
![]() The short-term trend has been DOWN since May 2nd, 2024 at 15.6670
The short-term trend has been DOWN since May 2nd, 2024 at 15.6670
Smart Scan Analysis for TSLY
Based on our trend formula, TSLY is rated as a +85 on a scale from -100 (Strong Downtrend) to +100 (Strong Uptrend).
| Open | High | Low | Price | Change |
|---|---|---|---|---|
| 14.64 | 14.97 | 14.48 | 14.89 | -0.20 |
| Prev. Close | Volume | Bid | Ask | Time |
| 14.89 | 838801 | 2024-05-08 15:59:41 |
| 52wk High | 36.96 | 52wk High Date | 2023-07-19 |
| 52wk Low | 12.7176 | 52wk Low Date | 2024-04-22 |
| Average Volume | 926,691 |