Stock Trend Analysis Report
Prepared for you on Thursday, May 9, 2024.
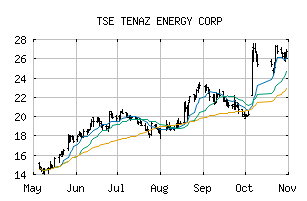
TENAZ ENERGY CORP (TSE:TNZ)
Weak Uptrend (+65) - TNZ is showing signs of weakening momentum to the upside. Monitor TNZ as it may be in the beginning stages of a reversal.
Is it time to buy, sell, or avoid TNZ?
MarketClub looks at technical strength and momentum to determine if the timing is right for TNZ.
Learn more about the Trade Triangles and how we make technical analysis as easy as buy and sell.
|
|||||||||||||||
|
|||||||||||||||
MarketClub’s Trade Triangles for TNZ
![]() The long-term trend has been UP since Apr 12th, 2024 at 4.13
The long-term trend has been UP since Apr 12th, 2024 at 4.13
![]() The intermediate-term trend has been UP since Apr 2nd, 2024 at 3.77
The intermediate-term trend has been UP since Apr 2nd, 2024 at 3.77
![]() The short-term trend has been DOWN since May 3rd, 2024 at 4.06
The short-term trend has been DOWN since May 3rd, 2024 at 4.06
Smart Scan Analysis for TNZ
Based on our trend formula, TNZ is rated as a +65 on a scale from -100 (Strong Downtrend) to +100 (Strong Uptrend).
+65
Strong Downtrend
Sideways
Strong Uptrend
| Open | High | Low | Price | Change |
|---|---|---|---|---|
| 3.98 | 4.00 | 3.94 | 3.99 | +0.04 |
| Prev. Close | Volume | Bid | Ask | Time |
| 3.97 | 10401 | 2024-05-08 15:44:49 |
Get a free daily analysis and signals for TENAZ ENERGY CORP (TNZ) - Request Your Free Report.