Forex Trend Analysis Report
Prepared for you on Thursday, May 9, 2024.
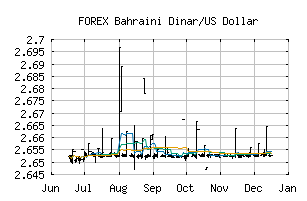
Bahraini Dinar/US Dollar (FOREX:BHDUSD)
Weak Downtrend (-65) - BHDUSD is showing signs of a strengthening downtrend. Monitor BHDUSD as it may be building momentum to the downside.
Is it time to buy, sell, or avoid BHDUSD?
MarketClub looks at technical strength and momentum to determine if the timing is right for BHDUSD.
Learn more about the Trade Triangles and how we make technical analysis as easy as buy and sell.
|
|||||||||||||||
|
|||||||||||||||
MarketClub’s Trade Triangles for BHDUSD
![]() The long-term trend has been DOWN since Oct 6th, 2023 at 2.6474054
The long-term trend has been DOWN since Oct 6th, 2023 at 2.6474054
![]() The intermediate-term trend has been UP since May 5th, 2024 at 2.6549600
The intermediate-term trend has been UP since May 5th, 2024 at 2.6549600
![]() The short-term trend has been DOWN since May 8th, 2024 at 2.6525230
The short-term trend has been DOWN since May 8th, 2024 at 2.6525230
Smart Scan Analysis for BHDUSD
Based on our trend formula, BHDUSD is rated as a -65 on a scale from -100 (Strong Downtrend) to +100 (Strong Uptrend).
-65
Strong Downtrend
Sideways
Strong Uptrend
| Open | High | Low | Price | Change |
|---|---|---|---|---|
| 2.6523912 | 2.6527992 | 2.6523912 | 2.6527992 | +0.0004080 |
| Prev. Close | Volume | Bid | Ask | Time |
| 2.6523912 | 2024-05-09 01:09:26 |
Get a free daily analysis and signals for Bahraini Dinar/US Dollar (BHDUSD) - Request Your Free Report.