Forex Trend Analysis Report
Prepared for you on Thursday, May 9, 2024.
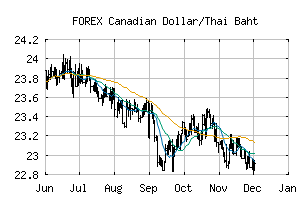
Canadian Dollar/Thai Baht (FOREX:CADTHB)
Bull Market Weakness (+75) - CADTHB is showing signs of short-term weakness, but still remains in the confines of a long-term uptrend. Keep an eye on CADTHB as it may be in the beginning stages of a reversal.
Is it time to buy, sell, or avoid CADTHB?
MarketClub looks at technical strength and momentum to determine if the timing is right for CADTHB.
Learn more about the Trade Triangles and how we make technical analysis as easy as buy and sell.
|
|||||||||||||||
|
|||||||||||||||
MarketClub’s Trade Triangles for CADTHB
![]() The long-term trend has been UP since Feb 8th, 2024 at 26.630518
The long-term trend has been UP since Feb 8th, 2024 at 26.630518
![]() The intermediate-term trend has been UP since Apr 29th, 2024 at 27.149423
The intermediate-term trend has been UP since Apr 29th, 2024 at 27.149423
![]() The short-term trend has been UP since May 7th, 2024 at 26.959252
The short-term trend has been UP since May 7th, 2024 at 26.959252
Smart Scan Analysis for CADTHB
Based on our trend formula, CADTHB is rated as a +70 on a scale from -100 (Strong Downtrend) to +100 (Strong Uptrend).
| Open | High | Low | Price | Change |
|---|---|---|---|---|
| 26.898190 | 26.912642 | 26.855605 | 26.884385 | -0.013805 |
| Prev. Close | Volume | Bid | Ask | Time |
| 26.898190 | 2024-05-09 10:17:15 |