Forex Trend Analysis Report
Prepared for you on Thursday, May 9, 2024.
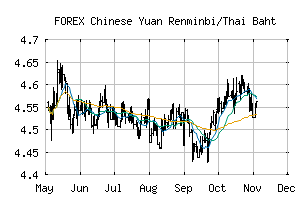
Chinese Yuan Renminbi/Thai Baht (FOREX:CNYTHB)
Long-Term Uptrend (+90) - CNYTHB is in a strong uptrend that is likely to continue. While CNYTHB is showing intraday weakness, it remains in the confines of a bullish trend. Traders should use caution and utilize a stop order.
Is it time to buy, sell, or avoid CNYTHB?
MarketClub looks at technical strength and momentum to determine if the timing is right for CNYTHB.
Learn more about the Trade Triangles and how we make technical analysis as easy as buy and sell.
|
|||||||||||||||
|
|||||||||||||||
MarketClub’s Trade Triangles for CNYTHB
![]() The long-term trend has been UP since Feb 20th, 2024 at 5.0896460
The long-term trend has been UP since Feb 20th, 2024 at 5.0896460
![]() The intermediate-term trend has been UP since Apr 17th, 2024 at 5.1906658
The intermediate-term trend has been UP since Apr 17th, 2024 at 5.1906658
![]() The short-term trend has been UP since May 7th, 2024 at 5.2160742
The short-term trend has been UP since May 7th, 2024 at 5.2160742
Smart Scan Analysis for CNYTHB
Based on our trend formula, CNYTHB is rated as a +90 on a scale from -100 (Strong Downtrend) to +100 (Strong Uptrend).
| Open | High | Low | Price | Change |
|---|---|---|---|---|
| 5.2097475 | 5.2131070 | 5.1906128 | 5.2072849 | -0.0024630 |
| Prev. Close | Volume | Bid | Ask | Time |
| 5.2097475 | 2024-05-09 07:25:28 |