Forex Trend Analysis Report
Prepared for you on Wednesday, May 1, 2024.
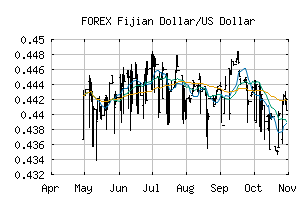
Fijian Dollar/US Dollar (FOREX:FJDUSD)
Weak Downtrend (-65) - FJDUSD is showing signs of a strengthening downtrend. Monitor FJDUSD as it may be building momentum to the downside.
Is it time to buy, sell, or avoid FJDUSD?
MarketClub looks at technical strength and momentum to determine if the timing is right for FJDUSD.
Learn more about the Trade Triangles and how we make technical analysis as easy as buy and sell.
|
|||||||||||||||
|
|||||||||||||||
MarketClub’s Trade Triangles for FJDUSD
![]() The long-term trend has been UP since Aug 14th, 2023 at 0.47274691
The long-term trend has been UP since Aug 14th, 2023 at 0.47274691
![]() The intermediate-term trend has been DOWN since Apr 15th, 2024 at 0.43880322
The intermediate-term trend has been DOWN since Apr 15th, 2024 at 0.43880322
![]() The short-term trend has been DOWN since Apr 30th, 2024 at 0.43839923
The short-term trend has been DOWN since Apr 30th, 2024 at 0.43839923
Smart Scan Analysis for FJDUSD
Based on our trend formula, FJDUSD is rated as a -70 on a scale from -100 (Strong Downtrend) to +100 (Strong Uptrend).
| Open | High | Low | Price | Change |
|---|---|---|---|---|
| 0.44240386 | 0.44240386 | 0.43479693 | 0.43479693 | -0.00760700 |
| Prev. Close | Volume | Bid | Ask | Time |
| 0.43654660 | 2024-04-30 23:58:20 |