Forex Trend Analysis Report
Prepared for you on Thursday, May 9, 2024.
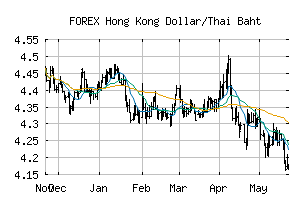
Hong Kong Dollar/Thai Baht (FOREX:HKDTHB)
Long-Term Uptrend (+90) - HKDTHB is in a strong uptrend that is likely to continue. While HKDTHB is showing intraday weakness, it remains in the confines of a bullish trend. Traders should use caution and utilize a stop order.
Is it time to buy, sell, or avoid HKDTHB?
MarketClub looks at technical strength and momentum to determine if the timing is right for HKDTHB.
Learn more about the Trade Triangles and how we make technical analysis as easy as buy and sell.
|
|||||||||||||||
|
|||||||||||||||
MarketClub’s Trade Triangles for HKDTHB
![]() The long-term trend has been UP since Mar 21st, 2024 at 4.6300930
The long-term trend has been UP since Mar 21st, 2024 at 4.6300930
![]() The intermediate-term trend has been UP since Mar 19th, 2024 at 4.6165356
The intermediate-term trend has been UP since Mar 19th, 2024 at 4.6165356
![]() The short-term trend has been UP since May 7th, 2024 at 4.7171657
The short-term trend has been UP since May 7th, 2024 at 4.7171657
Smart Scan Analysis for HKDTHB
Based on our trend formula, HKDTHB is rated as a +90 on a scale from -100 (Strong Downtrend) to +100 (Strong Uptrend).
| Open | High | Low | Price | Change |
|---|---|---|---|---|
| 4.7232744 | 4.7236905 | 4.7226663 | 4.7235714 | +0.0002970 |
| Prev. Close | Volume | Bid | Ask | Time |
| 4.7232744 | 2024-05-09 00:08:03 |