Forex Trend Analysis Report
Prepared for you on Thursday, May 9, 2024.
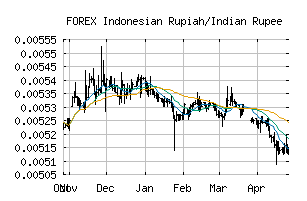
Indonesian Rupiah/Indian Rupee (FOREX:IDRINR)
Weak Downtrend (-65) - IDRINR is showing signs of a strengthening downtrend. Monitor IDRINR as it may be building momentum to the downside.
Is it time to buy, sell, or avoid IDRINR?
MarketClub looks at technical strength and momentum to determine if the timing is right for IDRINR.
Learn more about the Trade Triangles and how we make technical analysis as easy as buy and sell.
|
|||||||||||||||
|
|||||||||||||||
MarketClub’s Trade Triangles for IDRINR
![]() The long-term trend has been DOWN since Jul 3rd, 2023 at 0.00543799
The long-term trend has been DOWN since Jul 3rd, 2023 at 0.00543799
![]() The intermediate-term trend has been DOWN since Mar 31st, 2024 at 0.00524022
The intermediate-term trend has been DOWN since Mar 31st, 2024 at 0.00524022
![]() The short-term trend has been UP since May 1st, 2024 at 0.00514758
The short-term trend has been UP since May 1st, 2024 at 0.00514758
Smart Scan Analysis for IDRINR
Based on our trend formula, IDRINR is rated as a -65 on a scale from -100 (Strong Downtrend) to +100 (Strong Uptrend).
| Open | High | Low | Price | Change |
|---|---|---|---|---|
| 0.00519512 | 0.00520419 | 0.00519414 | 0.00519428 | -0.00000100 |
| Prev. Close | Volume | Bid | Ask | Time |
| 0.00519512 | 2024-05-09 08:22:08 |