Forex Trend Analysis Report
Prepared for you on Monday, May 6, 2024.
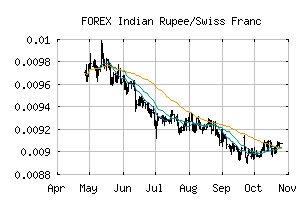
Indian Rupee/Swiss Franc (FOREX:INRCHF)
Weak Uptrend (+65) - INRCHF is showing signs of weakening momentum to the upside. Monitor INRCHF as it may be in the beginning stages of a reversal.
Is it time to buy, sell, or avoid INRCHF?
MarketClub looks at technical strength and momentum to determine if the timing is right for INRCHF.
Learn more about the Trade Triangles and how we make technical analysis as easy as buy and sell.
|
|||||||||||||||
|
|||||||||||||||
MarketClub’s Trade Triangles for INRCHF
![]() The long-term trend has been UP since Mar 1st, 2024 at 0.01070094
The long-term trend has been UP since Mar 1st, 2024 at 0.01070094
![]() The intermediate-term trend has been UP since Apr 24th, 2024 at 0.01097949
The intermediate-term trend has been UP since Apr 24th, 2024 at 0.01097949
![]() The short-term trend has been DOWN since May 3rd, 2024 at 0.01090301
The short-term trend has been DOWN since May 3rd, 2024 at 0.01090301
Smart Scan Analysis for INRCHF
Based on our trend formula, INRCHF is rated as a +65 on a scale from -100 (Strong Downtrend) to +100 (Strong Uptrend).
| Open | High | Low | Price | Change |
|---|---|---|---|---|
| 0.01087681 | 0.01088227 | 0.01087669 | 0.01087909 | +0.00000200 |
| Prev. Close | Volume | Bid | Ask | Time |
| 0.01087681 | 2024-05-06 00:41:09 |