Forex Trend Analysis Report
Prepared for you on Thursday, May 9, 2024.
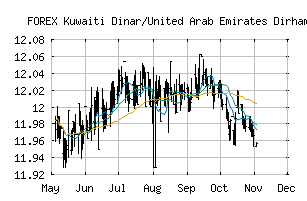
Kuwaiti Dinar/United Arab Emirates Dirham (FOREX:KWDAED)
Sidelines Mode (-55) - KWDAED is moving in a sideways pattern and is unable to gain momentum in either direction. Beware of choppy movement and consider a sidelines position until a stronger trend is identified.
Is it time to buy, sell, or avoid KWDAED?
MarketClub looks at technical strength and momentum to determine if the timing is right for KWDAED.
Learn more about the Trade Triangles and how we make technical analysis as easy as buy and sell.
|
|||||||||||||||
|
|||||||||||||||
MarketClub’s Trade Triangles for KWDAED
![]() The long-term trend has been DOWN since Apr 4th, 2024 at 11.904363
The long-term trend has been DOWN since Apr 4th, 2024 at 11.904363
![]() The intermediate-term trend has been UP since May 3rd, 2024 at 11.951411
The intermediate-term trend has been UP since May 3rd, 2024 at 11.951411
![]() The short-term trend has been DOWN since May 9th, 2024 at 11.938139
The short-term trend has been DOWN since May 9th, 2024 at 11.938139
Smart Scan Analysis for KWDAED
Based on our trend formula, KWDAED is rated as a -55 on a scale from -100 (Strong Downtrend) to +100 (Strong Uptrend).
| Open | High | Low | Price | Change |
|---|---|---|---|---|
| 11.942520 | 11.951603 | 11.931684 | 11.942140 | -0.000380 |
| Prev. Close | Volume | Bid | Ask | Time |
| 11.942520 | 2024-05-09 14:35:32 |