Forex Trend Analysis Report
Prepared for you on Thursday, May 9, 2024.
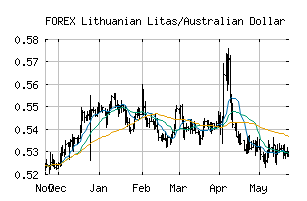
Lithuanian Litas/Australian Dollar (FOREX:LTLAUD)
Sidelines Mode (-55) - LTLAUD is moving in a sideways pattern and is unable to gain momentum in either direction. Beware of choppy movement and consider a sidelines position until a stronger trend is identified.
Is it time to buy, sell, or avoid LTLAUD?
MarketClub looks at technical strength and momentum to determine if the timing is right for LTLAUD.
Learn more about the Trade Triangles and how we make technical analysis as easy as buy and sell.
|
|||||||||||||||
|
|||||||||||||||
MarketClub’s Trade Triangles for LTLAUD
![]() The long-term trend has been UP since Apr 15th, 2024 at 0.52916758
The long-term trend has been UP since Apr 15th, 2024 at 0.52916758
![]() The intermediate-term trend has been DOWN since May 3rd, 2024 at 0.51300189
The intermediate-term trend has been DOWN since May 3rd, 2024 at 0.51300189
![]() The short-term trend has been UP since May 8th, 2024 at 0.51893706
The short-term trend has been UP since May 8th, 2024 at 0.51893706
Smart Scan Analysis for LTLAUD
Based on our trend formula, LTLAUD is rated as a -55 on a scale from -100 (Strong Downtrend) to +100 (Strong Uptrend).
| Open | High | Low | Price | Change |
|---|---|---|---|---|
| 0.51792387 | 0.51925324 | 0.51751898 | 0.51841615 | +0.00049200 |
| Prev. Close | Volume | Bid | Ask | Time |
| 0.51792387 | 2024-05-09 05:43:32 |