Forex Trend Analysis Report
Prepared for you on Thursday, May 9, 2024.
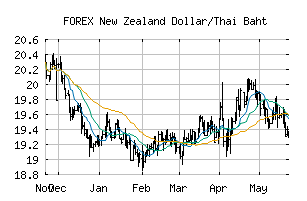
New Zealand Dollar/Thai Baht (FOREX:NZDTHB)
Strong Uptrend (+100) - NZDTHB is in a strong uptrend that is likely to continue. With short-term, intermediate, and long-term bullish momentum, NZDTHB continues to climb. Traders should protect gains and look for a change in score to suggest a slow down in momentum.
Is it time to buy, sell, or avoid NZDTHB?
MarketClub looks at technical strength and momentum to determine if the timing is right for NZDTHB.
Learn more about the Trade Triangles and how we make technical analysis as easy as buy and sell.
|
|||||||||||||||
|
|||||||||||||||
MarketClub’s Trade Triangles for NZDTHB
![]() The long-term trend has been UP since Oct 2nd, 2023 at 22.058686
The long-term trend has been UP since Oct 2nd, 2023 at 22.058686
![]() The intermediate-term trend has been UP since May 7th, 2024 at 22.164722
The intermediate-term trend has been UP since May 7th, 2024 at 22.164722
![]() The short-term trend has been UP since May 3rd, 2024 at 22.056054
The short-term trend has been UP since May 3rd, 2024 at 22.056054
Smart Scan Analysis for NZDTHB
Based on our trend formula, NZDTHB is rated as a +100 on a scale from -100 (Strong Downtrend) to +100 (Strong Uptrend).
| Open | High | Low | Price | Change |
|---|---|---|---|---|
| 22.170445 | 22.178561 | 22.113259 | 22.158277 | -0.012168 |
| Prev. Close | Volume | Bid | Ask | Time |
| 22.170445 | 2024-05-09 10:06:26 |