Forex Trend Analysis Report
Prepared for you on Thursday, May 2, 2024.
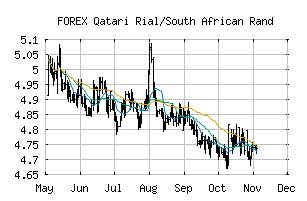
Qatari Rial/South African Rand (FOREX:QARZAR)
Sidelines Mode (+55) - QARZAR is moving in a sideways pattern and is unable to gain momentum in either direction. Beware of choppy movement and consider a sidelines position until a stronger trend is identified.
Is it time to buy, sell, or avoid QARZAR?
MarketClub looks at technical strength and momentum to determine if the timing is right for QARZAR.
Learn more about the Trade Triangles and how we make technical analysis as easy as buy and sell.
|
|||||||||||||||
|
|||||||||||||||
MarketClub’s Trade Triangles for QARZAR
![]() The long-term trend has been UP since Oct 3rd, 2023 at 5.2981331
The long-term trend has been UP since Oct 3rd, 2023 at 5.2981331
![]() The intermediate-term trend has been UP since Apr 16th, 2024 at 5.2249835
The intermediate-term trend has been UP since Apr 16th, 2024 at 5.2249835
![]() The short-term trend has been DOWN since Apr 25th, 2024 at 5.2297562
The short-term trend has been DOWN since Apr 25th, 2024 at 5.2297562
Smart Scan Analysis for QARZAR
Based on our trend formula, QARZAR is rated as a +55 on a scale from -100 (Strong Downtrend) to +100 (Strong Uptrend).
| Open | High | Low | Price | Change |
|---|---|---|---|---|
| 5.1126548 | 5.1320095 | 5.0881287 | 5.0962892 | -0.0163660 |
| Prev. Close | Volume | Bid | Ask | Time |
| 5.1126548 | 2024-05-02 19:23:41 |