Forex Trend Analysis Report
Prepared for you on Monday, May 6, 2024.
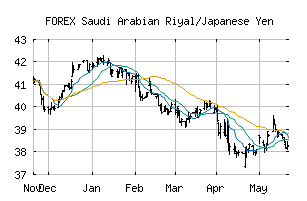
Saudi Arabian Riyal/Japanese Yen (FOREX:SARJPY)
Weak Uptrend (+65) - SARJPY is showing signs of weakening momentum to the upside. Monitor SARJPY as it may be in the beginning stages of a reversal.
Is it time to buy, sell, or avoid SARJPY?
MarketClub looks at technical strength and momentum to determine if the timing is right for SARJPY.
Learn more about the Trade Triangles and how we make technical analysis as easy as buy and sell.
|
|||||||||||||||
|
|||||||||||||||
MarketClub’s Trade Triangles for SARJPY
![]() The long-term trend has been UP since Mar 19th, 2024 at 40.224148
The long-term trend has been UP since Mar 19th, 2024 at 40.224148
![]() The intermediate-term trend has been UP since Mar 19th, 2024 at 40.206868
The intermediate-term trend has been UP since Mar 19th, 2024 at 40.206868
![]() The short-term trend has been DOWN since Apr 29th, 2024 at 41.447809
The short-term trend has been DOWN since Apr 29th, 2024 at 41.447809
Smart Scan Analysis for SARJPY
Based on our trend formula, SARJPY is rated as a +65 on a scale from -100 (Strong Downtrend) to +100 (Strong Uptrend).
| Open | High | Low | Price | Change |
|---|---|---|---|---|
| 41.051925 | 41.053660 | 40.908479 | 41.038513 | -0.013412 |
| Prev. Close | Volume | Bid | Ask | Time |
| 41.051925 | 2024-05-06 12:18:50 |