Forex Trend Analysis Report
Prepared for you on Thursday, May 9, 2024.
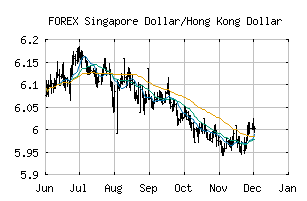
Singapore Dollar/Hong Kong Dollar (FOREX:SGDHKD)
Weak Downtrend (-65) - SGDHKD is showing signs of a strengthening downtrend. Monitor SGDHKD as it may be building momentum to the downside.
Is it time to buy, sell, or avoid SGDHKD?
MarketClub looks at technical strength and momentum to determine if the timing is right for SGDHKD.
Learn more about the Trade Triangles and how we make technical analysis as easy as buy and sell.
|
|||||||||||||||
|
|||||||||||||||
MarketClub’s Trade Triangles for SGDHKD
![]() The long-term trend has been DOWN since Apr 1st, 2024 at 5.7809188
The long-term trend has been DOWN since Apr 1st, 2024 at 5.7809188
![]() The intermediate-term trend has been DOWN since Mar 27th, 2024 at 5.8095848
The intermediate-term trend has been DOWN since Mar 27th, 2024 at 5.8095848
![]() The short-term trend has been DOWN since May 7th, 2024 at 5.7718012
The short-term trend has been DOWN since May 7th, 2024 at 5.7718012
Smart Scan Analysis for SGDHKD
Based on our trend formula, SGDHKD is rated as a -70 on a scale from -100 (Strong Downtrend) to +100 (Strong Uptrend).
| Open | High | Low | Price | Change |
|---|---|---|---|---|
| 5.7681000 | 5.7700825 | 5.7646853 | 5.7665111 | -0.0015890 |
| Prev. Close | Volume | Bid | Ask | Time |
| 5.7681000 | 2024-05-09 01:11:26 |