Forex Trend Analysis Report
Prepared for you on Wednesday, May 1, 2024.
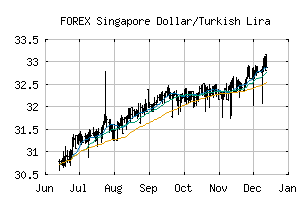
Singapore Dollar/Turkish Lira (FOREX:SGDTRY)
Weak Downtrend (-65) - SGDTRY is showing signs of a strengthening downtrend. Monitor SGDTRY as it may be building momentum to the downside.
Is it time to buy, sell, or avoid SGDTRY?
MarketClub looks at technical strength and momentum to determine if the timing is right for SGDTRY.
Learn more about the Trade Triangles and how we make technical analysis as easy as buy and sell.
|
|||||||||||||||
|
|||||||||||||||
MarketClub’s Trade Triangles for SGDTRY
![]() The long-term trend has been UP since Oct 8th, 2021 at 6.5797092
The long-term trend has been UP since Oct 8th, 2021 at 6.5797092
![]() The intermediate-term trend has been DOWN since Apr 29th, 2024 at 23.6288570
The intermediate-term trend has been DOWN since Apr 29th, 2024 at 23.6288570
![]() The short-term trend has been DOWN since Apr 26th, 2024 at 23.8375820
The short-term trend has been DOWN since Apr 26th, 2024 at 23.8375820
Smart Scan Analysis for SGDTRY
Based on our trend formula, SGDTRY is rated as a -70 on a scale from -100 (Strong Downtrend) to +100 (Strong Uptrend).
| Open | High | Low | Price | Change |
|---|---|---|---|---|
| 23.732809 | 23.909423 | 23.710617 | 23.723262 | -0.009547 |
| Prev. Close | Volume | Bid | Ask | Time |
| 23.732809 | 2024-05-01 20:19:42 |