Forex Trend Analysis Report
Prepared for you on Thursday, May 9, 2024.
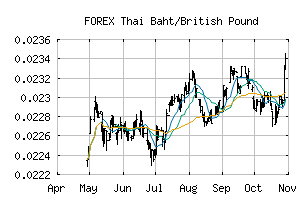
Thai Baht/British Pound (FOREX:THBGBP)
Weak Downtrend (-65) - THBGBP is showing signs of a strengthening downtrend. Monitor THBGBP as it may be building momentum to the downside.
Is it time to buy, sell, or avoid THBGBP?
MarketClub looks at technical strength and momentum to determine if the timing is right for THBGBP.
Learn more about the Trade Triangles and how we make technical analysis as easy as buy and sell.
|
|||||||||||||||
|
|||||||||||||||
MarketClub’s Trade Triangles for THBGBP
![]() The long-term trend has been DOWN since Jan 22nd, 2024 at 0.02207862
The long-term trend has been DOWN since Jan 22nd, 2024 at 0.02207862
![]() The intermediate-term trend has been DOWN since Apr 29th, 2024 at 0.02150785
The intermediate-term trend has been DOWN since Apr 29th, 2024 at 0.02150785
![]() The short-term trend has been DOWN since May 7th, 2024 at 0.02162442
The short-term trend has been DOWN since May 7th, 2024 at 0.02162442
Smart Scan Analysis for THBGBP
Based on our trend formula, THBGBP is rated as a -70 on a scale from -100 (Strong Downtrend) to +100 (Strong Uptrend).
| Open | High | Low | Price | Change |
|---|---|---|---|---|
| 0.02167551 | 0.02171965 | 0.02167551 | 0.02171965 | +0.00004400 |
| Prev. Close | Volume | Bid | Ask | Time |
| 0.02167551 | 2024-05-09 03:12:16 |