Forex Trend Analysis Report
Prepared for you on Thursday, May 9, 2024.
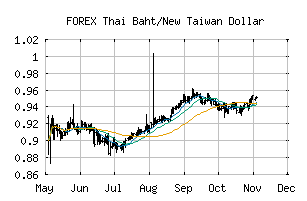
Thai Baht/New Taiwan Dollar (FOREX:THBTWD)
Strong Downtrend (-100) - THBTWD is in a strong downtrend that is likely to continue. With short-term, intermediate, and long-term bearish momentum, THBTWD continues to fall. Traders should use caution and set stops.
Is it time to buy, sell, or avoid THBTWD?
MarketClub looks at technical strength and momentum to determine if the timing is right for THBTWD.
Learn more about the Trade Triangles and how we make technical analysis as easy as buy and sell.
|
|||||||||||||||
|
|||||||||||||||
MarketClub’s Trade Triangles for THBTWD
![]() The long-term trend has been DOWN since Oct 2nd, 2023 at 0.8751629
The long-term trend has been DOWN since Oct 2nd, 2023 at 0.8751629
![]() The intermediate-term trend has been DOWN since May 8th, 2024 at 0.8752897
The intermediate-term trend has been DOWN since May 8th, 2024 at 0.8752897
![]() The short-term trend has been DOWN since May 7th, 2024 at 0.8762408
The short-term trend has been DOWN since May 7th, 2024 at 0.8762408
Smart Scan Analysis for THBTWD
Based on our trend formula, THBTWD is rated as a -100 on a scale from -100 (Strong Downtrend) to +100 (Strong Uptrend).
| Open | High | Low | Price | Change |
|---|---|---|---|---|
| 0.8779067 | 0.8794303 | 0.8775853 | 0.8786853 | +0.0007790 |
| Prev. Close | Volume | Bid | Ask | Time |
| 0.8779067 | 2024-05-09 04:20:36 |