Forex Trend Analysis Report
Prepared for you on Tuesday, May 7, 2024.
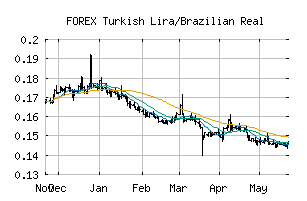
Turkish Lira/Brazilian Real (FOREX:TRYBRL)
Bear Market Rally (-75) - TRYBRL is showing some rallying power, but still remains in the confines of a long-term downtrend. Keep an eye on TRYBRL as it may be in the beginning of a reversal.
Is it time to buy, sell, or avoid TRYBRL?
MarketClub looks at technical strength and momentum to determine if the timing is right for TRYBRL.
Learn more about the Trade Triangles and how we make technical analysis as easy as buy and sell.
|
|||||||||||||||
|
|||||||||||||||
MarketClub’s Trade Triangles for TRYBRL
![]() The long-term trend has been DOWN since Nov 4th, 2021 at 0.57468074
The long-term trend has been DOWN since Nov 4th, 2021 at 0.57468074
![]() The intermediate-term trend has been UP since Apr 1st, 2024 at 0.15689273
The intermediate-term trend has been UP since Apr 1st, 2024 at 0.15689273
![]() The short-term trend has been DOWN since May 2nd, 2024 at 0.15707584
The short-term trend has been DOWN since May 2nd, 2024 at 0.15707584
Smart Scan Analysis for TRYBRL
Based on our trend formula, TRYBRL is rated as a -75 on a scale from -100 (Strong Downtrend) to +100 (Strong Uptrend).
| Open | High | Low | Price | Change |
|---|---|---|---|---|
| 0.15722178 | 0.15761934 | 0.15644499 | 0.15722980 | +0.00000800 |
| Prev. Close | Volume | Bid | Ask | Time |
| 0.15722178 | 2024-05-07 21:00:31 |