Forex Trend Analysis Report
Prepared for you on Friday, May 3, 2024.
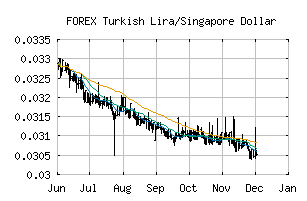
Turkish Lira/Singapore Dollar (FOREX:TRYSGD)
Long-Term Downtrend (-90) - TRYSGD is in a strong downtrend that is likely to continue. While TRYSGD is showing intraday strength, it remains in the confines of a bearish trend. Traders should use caution and set stops.
Is it time to buy, sell, or avoid TRYSGD?
MarketClub looks at technical strength and momentum to determine if the timing is right for TRYSGD.
Learn more about the Trade Triangles and how we make technical analysis as easy as buy and sell.
|
|||||||||||||||
|
|||||||||||||||
MarketClub’s Trade Triangles for TRYSGD
![]() The long-term trend has been DOWN since Oct 8th, 2021 at 0.15197753
The long-term trend has been DOWN since Oct 8th, 2021 at 0.15197753
![]() The intermediate-term trend has been DOWN since Apr 11th, 2024 at 0.04106500
The intermediate-term trend has been DOWN since Apr 11th, 2024 at 0.04106500
![]() The short-term trend has been DOWN since May 2nd, 2024 at 0.04169388
The short-term trend has been DOWN since May 2nd, 2024 at 0.04169388
Smart Scan Analysis for TRYSGD
Based on our trend formula, TRYSGD is rated as a -90 on a scale from -100 (Strong Downtrend) to +100 (Strong Uptrend).
| Open | High | Low | Price | Change |
|---|---|---|---|---|
| 0.04176546 | 0.04185243 | 0.04158672 | 0.04174805 | -0.00001700 |
| Prev. Close | Volume | Bid | Ask | Time |
| 0.04176546 | 2024-05-03 17:04:56 |