Forex Trend Analysis Report
Prepared for you on Thursday, May 9, 2024.
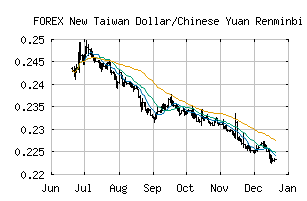
New Taiwan Dollar/Chinese Yuan Renminbi (FOREX:TWDCNY)
Sidelines Mode (-55) - TWDCNY is moving in a sideways pattern and is unable to gain momentum in either direction. Beware of choppy movement and consider a sidelines position until a stronger trend is identified.
Is it time to buy, sell, or avoid TWDCNY?
MarketClub looks at technical strength and momentum to determine if the timing is right for TWDCNY.
Learn more about the Trade Triangles and how we make technical analysis as easy as buy and sell.
|
|||||||||||||||
|
|||||||||||||||
MarketClub’s Trade Triangles for TWDCNY
![]() The long-term trend has been DOWN since Mar 18th, 2024 at 0.22363895
The long-term trend has been DOWN since Mar 18th, 2024 at 0.22363895
![]() The intermediate-term trend has been UP since May 6th, 2024 at 0.21969227
The intermediate-term trend has been UP since May 6th, 2024 at 0.21969227
![]() The short-term trend has been DOWN since May 7th, 2024 at 0.21825884
The short-term trend has been DOWN since May 7th, 2024 at 0.21825884
Smart Scan Analysis for TWDCNY
Based on our trend formula, TWDCNY is rated as a -55 on a scale from -100 (Strong Downtrend) to +100 (Strong Uptrend).
| Open | High | Low | Price | Change |
|---|---|---|---|---|
| 0.21914673 | 0.21932459 | 0.21841752 | 0.21860150 | -0.00054500 |
| Prev. Close | Volume | Bid | Ask | Time |
| 0.21914673 | 2024-05-09 10:15:34 |