Forex Trend Analysis Report
Prepared for you on Thursday, May 9, 2024.
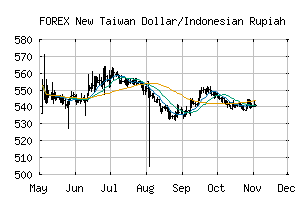
New Taiwan Dollar/Indonesian Rupiah (FOREX:TWDIDR)
Sidelines Mode (+55) - TWDIDR is moving in a sideways pattern and is unable to gain momentum in either direction. Beware of choppy movement and consider a sidelines position until a stronger trend is identified.
Is it time to buy, sell, or avoid TWDIDR?
MarketClub looks at technical strength and momentum to determine if the timing is right for TWDIDR.
Learn more about the Trade Triangles and how we make technical analysis as easy as buy and sell.
|
|||||||||||||||
|
|||||||||||||||
MarketClub’s Trade Triangles for TWDIDR
![]() The long-term trend has been UP since Aug 1st, 2023 at 491.46567
The long-term trend has been UP since Aug 1st, 2023 at 491.46567
![]() The intermediate-term trend has been UP since Mar 31st, 2024 at 498.18219
The intermediate-term trend has been UP since Mar 31st, 2024 at 498.18219
![]() The short-term trend has been DOWN since May 1st, 2024 at 497.17486
The short-term trend has been DOWN since May 1st, 2024 at 497.17486
Smart Scan Analysis for TWDIDR
Based on our trend formula, TWDIDR is rated as a +55 on a scale from -100 (Strong Downtrend) to +100 (Strong Uptrend).
| Open | High | Low | Price | Change |
|---|---|---|---|---|
| 495.55521 | 495.58941 | 495.03283 | 495.45917 | -0.09604 |
| Prev. Close | Volume | Bid | Ask | Time |
| 495.55521 | 2024-05-09 03:02:47 |