Forex Trend Analysis Report
Prepared for you on Thursday, May 9, 2024.
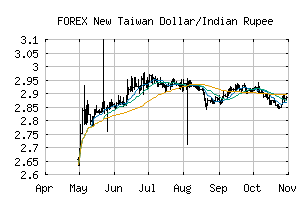
New Taiwan Dollar/Indian Rupee (FOREX:TWDINR)
Weak Downtrend (-65) - TWDINR is showing signs of a strengthening downtrend. Monitor TWDINR as it may be building momentum to the downside.
Is it time to buy, sell, or avoid TWDINR?
MarketClub looks at technical strength and momentum to determine if the timing is right for TWDINR.
Learn more about the Trade Triangles and how we make technical analysis as easy as buy and sell.
|
|||||||||||||||
|
|||||||||||||||
MarketClub’s Trade Triangles for TWDINR
![]() The long-term trend has been DOWN since Mar 11th, 2024 at 2.6137901
The long-term trend has been DOWN since Mar 11th, 2024 at 2.6137901
![]() The intermediate-term trend has been DOWN since Mar 11th, 2024 at 2.6137901
The intermediate-term trend has been DOWN since Mar 11th, 2024 at 2.6137901
![]() The short-term trend has been DOWN since May 7th, 2024 at 2.5754023
The short-term trend has been DOWN since May 7th, 2024 at 2.5754023
Smart Scan Analysis for TWDINR
Based on our trend formula, TWDINR is rated as a -70 on a scale from -100 (Strong Downtrend) to +100 (Strong Uptrend).
| Open | High | Low | Price | Change |
|---|---|---|---|---|
| 2.5743854 | 2.5762021 | 2.5730373 | 2.5746855 | +0.0003000 |
| Prev. Close | Volume | Bid | Ask | Time |
| 2.5743854 | 2024-05-09 08:24:16 |