Forex Trend Analysis Report
Prepared for you on Thursday, May 9, 2024.
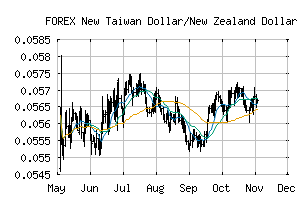
New Taiwan Dollar/New Zealand Dollar (FOREX:TWDNZD)
Strong Downtrend (-100) - TWDNZD is in a strong downtrend that is likely to continue. With short-term, intermediate, and long-term bearish momentum, TWDNZD continues to fall. Traders should use caution and set stops.
Is it time to buy, sell, or avoid TWDNZD?
MarketClub looks at technical strength and momentum to determine if the timing is right for TWDNZD.
Learn more about the Trade Triangles and how we make technical analysis as easy as buy and sell.
|
|||||||||||||||
|
|||||||||||||||
MarketClub’s Trade Triangles for TWDNZD
![]() The long-term trend has been DOWN since May 8th, 2023 at 0.05146838
The long-term trend has been DOWN since May 8th, 2023 at 0.05146838
![]() The intermediate-term trend has been DOWN since Apr 28th, 2024 at 0.05140447
The intermediate-term trend has been DOWN since Apr 28th, 2024 at 0.05140447
![]() The short-term trend has been DOWN since May 3rd, 2024 at 0.05153113
The short-term trend has been DOWN since May 3rd, 2024 at 0.05153113
Smart Scan Analysis for TWDNZD
Based on our trend formula, TWDNZD is rated as a -100 on a scale from -100 (Strong Downtrend) to +100 (Strong Uptrend).
| Open | High | Low | Price | Change |
|---|---|---|---|---|
| 0.05135966 | 0.05146947 | 0.05117421 | 0.05118986 | -0.00017000 |
| Prev. Close | Volume | Bid | Ask | Time |
| 0.05135966 | 2024-05-09 16:00:40 |