Forex Trend Analysis Report
Prepared for you on Thursday, May 9, 2024.
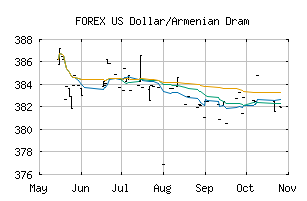
US Dollar/Armenian Dram (FOREX:USDAMD)
Countertrend Down (-85) - USDAMD is showing short-term strength. However, look for the longer-term bearish trend to resume. As always, continue to monitor the trend score and set stops.
Is it time to buy, sell, or avoid USDAMD?
MarketClub looks at technical strength and momentum to determine if the timing is right for USDAMD.
Learn more about the Trade Triangles and how we make technical analysis as easy as buy and sell.
|
|||||||||||||||
|
|||||||||||||||
MarketClub’s Trade Triangles for USDAMD
![]() The long-term trend has been DOWN since Mar 21st, 2024 at 399.39797
The long-term trend has been DOWN since Mar 21st, 2024 at 399.39797
![]() The intermediate-term trend has been DOWN since May 2nd, 2024 at 387.42347
The intermediate-term trend has been DOWN since May 2nd, 2024 at 387.42347
![]() The short-term trend has been UP since May 7th, 2024 at 387.81473
The short-term trend has been UP since May 7th, 2024 at 387.81473
Smart Scan Analysis for USDAMD
Based on our trend formula, USDAMD is rated as a -85 on a scale from -100 (Strong Downtrend) to +100 (Strong Uptrend).
| Open | High | Low | Price | Change |
|---|---|---|---|---|
| 387.93744 | 388.62683 | 387.93744 | 388.62683 | +0.68939 |
| Prev. Close | Volume | Bid | Ask | Time |
| 387.95470 | 2024-05-07 21:05:08 |