Forex Trend Analysis Report
Prepared for you on Thursday, May 9, 2024.
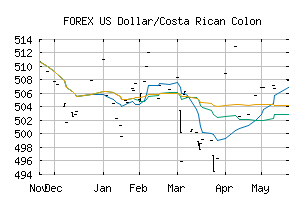
US Dollar/Costa Rican Colon (FOREX:USDCRC)
Weak Downtrend (-65) - USDCRC is showing signs of a strengthening downtrend. Monitor USDCRC as it may be building momentum to the downside.
Is it time to buy, sell, or avoid USDCRC?
MarketClub looks at technical strength and momentum to determine if the timing is right for USDCRC.
Learn more about the Trade Triangles and how we make technical analysis as easy as buy and sell.
|
|||||||||||||||
|
|||||||||||||||
MarketClub’s Trade Triangles for USDCRC
![]() The long-term trend has been DOWN since Aug 19th, 2022 at 661.99071
The long-term trend has been DOWN since Aug 19th, 2022 at 661.99071
![]() The intermediate-term trend has been DOWN since Apr 17th, 2024 at 501.71006
The intermediate-term trend has been DOWN since Apr 17th, 2024 at 501.71006
![]() The short-term trend has been DOWN since May 5th, 2024 at 510.22512
The short-term trend has been DOWN since May 5th, 2024 at 510.22512
Smart Scan Analysis for USDCRC
Based on our trend formula, USDCRC is rated as a -70 on a scale from -100 (Strong Downtrend) to +100 (Strong Uptrend).
| Open | High | Low | Price | Change |
|---|---|---|---|---|
| 510.26856 | 510.26856 | 510.26856 | 510.26856 | 0.00000 |
| Prev. Close | Volume | Bid | Ask | Time |
| 512.15221 | 2024-05-06 01:56:05 |