Forex Trend Analysis Report
Prepared for you on Thursday, May 9, 2024.
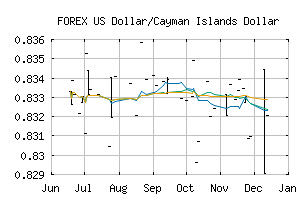
US Dollar/Cayman Islands Dollar (FOREX:USDKYD)
Crossroads (+60) - USDKYD is struggling to move into a solid trend. Beware of choppy markets and consider a sidelines position until a stronger trend is identified.
Is it time to buy, sell, or avoid USDKYD?
MarketClub looks at technical strength and momentum to determine if the timing is right for USDKYD.
Learn more about the Trade Triangles and how we make technical analysis as easy as buy and sell.
|
|||||||||||||||
|
|||||||||||||||
MarketClub’s Trade Triangles for USDKYD
![]() The long-term trend has been DOWN since Apr 3rd, 2024 at 0.8297310
The long-term trend has been DOWN since Apr 3rd, 2024 at 0.8297310
![]() The intermediate-term trend has been UP since Apr 28th, 2024 at 0.8337220
The intermediate-term trend has been UP since Apr 28th, 2024 at 0.8337220
![]() The short-term trend has been UP since May 7th, 2024 at 0.8335747
The short-term trend has been UP since May 7th, 2024 at 0.8335747
Smart Scan Analysis for USDKYD
Based on our trend formula, USDKYD is rated as a +60 on a scale from -100 (Strong Downtrend) to +100 (Strong Uptrend).
| Open | High | Low | Price | Change |
|---|---|---|---|---|
| 0.8338492 | 0.8338492 | 0.8338492 | 0.8338492 | 0.0000000 |
| Prev. Close | Volume | Bid | Ask | Time |
| 0.8335197 | 2024-05-08 21:02:47 |