Forex Trend Analysis Report
Prepared for you on Thursday, May 9, 2024.
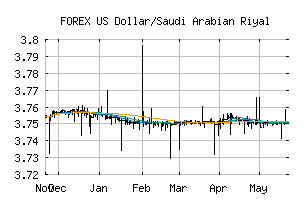
US Dollar/Saudi Arabian Riyal (FOREX:USDSAR)
Countertrend Down (-85) - USDSAR is showing short-term strength. However, look for the longer-term bearish trend to resume. As always, continue to monitor the trend score and set stops.
Is it time to buy, sell, or avoid USDSAR?
MarketClub looks at technical strength and momentum to determine if the timing is right for USDSAR.
Learn more about the Trade Triangles and how we make technical analysis as easy as buy and sell.
|
|||||||||||||||
|
|||||||||||||||
MarketClub’s Trade Triangles for USDSAR
![]() The long-term trend has been DOWN since Apr 24th, 2024 at 3.7287225
The long-term trend has been DOWN since Apr 24th, 2024 at 3.7287225
![]() The intermediate-term trend has been DOWN since Apr 2nd, 2024 at 3.7494120
The intermediate-term trend has been DOWN since Apr 2nd, 2024 at 3.7494120
![]() The short-term trend has been UP since May 8th, 2024 at 3.7509517
The short-term trend has been UP since May 8th, 2024 at 3.7509517
Smart Scan Analysis for USDSAR
Based on our trend formula, USDSAR is rated as a -85 on a scale from -100 (Strong Downtrend) to +100 (Strong Uptrend).
| Open | High | Low | Price | Change |
|---|---|---|---|---|
| 3.7504943 | 3.7505001 | 3.7504128 | 3.7504303 | -0.0000640 |
| Prev. Close | Volume | Bid | Ask | Time |
| 3.7504943 | 2024-05-09 01:24:40 |