Forex Trend Analysis Report
Prepared for you on Thursday, May 9, 2024.
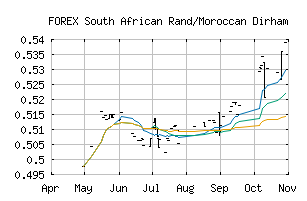
South African Rand/Moroccan Dirham (FOREX:ZARMAD)
Countertrend Up (+85) - ZARMAD is showing short-term weakness. However, look for the longer-term bullish trend to resume. As always, continue to monitor the trend score and utilize a stop order.
Is it time to buy, sell, or avoid ZARMAD?
MarketClub looks at technical strength and momentum to determine if the timing is right for ZARMAD.
Learn more about the Trade Triangles and how we make technical analysis as easy as buy and sell.
|
|||||||||||||||
|
|||||||||||||||
MarketClub’s Trade Triangles for ZARMAD
![]() The long-term trend has been UP since Apr 29th, 2024 at 0.54284208
The long-term trend has been UP since Apr 29th, 2024 at 0.54284208
![]() The intermediate-term trend has been UP since Apr 29th, 2024 at 0.54221175
The intermediate-term trend has been UP since Apr 29th, 2024 at 0.54221175
![]() The short-term trend has been DOWN since May 7th, 2024 at 0.54352940
The short-term trend has been DOWN since May 7th, 2024 at 0.54352940
Smart Scan Analysis for ZARMAD
Based on our trend formula, ZARMAD is rated as a +85 on a scale from -100 (Strong Downtrend) to +100 (Strong Uptrend).
| Open | High | Low | Price | Change |
|---|---|---|---|---|
| 0.54231797 | 0.54231797 | 0.54231797 | 0.54231797 | 0.00000000 |
| Prev. Close | Volume | Bid | Ask | Time |
| 0.54326992 | 2024-05-07 21:05:08 |