Forex Trend Analysis Report
Prepared for you on Sunday, May 5, 2024.
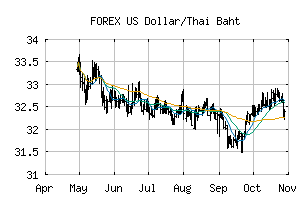
US Dollar/Thai Baht (FOREX:USDTHB)
Weak Uptrend (+65) - USDTHB is showing signs of weakening momentum to the upside. Monitor USDTHB as it may be in the beginning stages of a reversal.
Is it time to buy, sell, or avoid USDTHB?
MarketClub looks at technical strength and momentum to determine if the timing is right for USDTHB.
Learn more about the Trade Triangles and how we make technical analysis as easy as buy and sell.
|
|||||||||||||||
|
|||||||||||||||
MarketClub’s Trade Triangles for USDTHB
![]() The long-term trend has been UP since Mar 20th, 2024 at 36.210000
The long-term trend has been UP since Mar 20th, 2024 at 36.210000
![]() The intermediate-term trend has been UP since Mar 19th, 2024 at 36.113624
The intermediate-term trend has been UP since Mar 19th, 2024 at 36.113624
![]() The short-term trend has been DOWN since May 1st, 2024 at 36.955500
The short-term trend has been DOWN since May 1st, 2024 at 36.955500
Smart Scan Analysis for USDTHB
Based on our trend formula, USDTHB is rated as a +65 on a scale from -100 (Strong Downtrend) to +100 (Strong Uptrend).
| Open | High | Low | Price | Change |
|---|---|---|---|---|
| 36.758713 | 36.758714 | 36.758713 | 36.758714 | +0.000001 |
| Prev. Close | Volume | Bid | Ask | Time |
| 36.758713 | 2024-05-05 05:01:55 |