Index Trend Analysis Report
Prepared for you on Thursday, May 9, 2024.
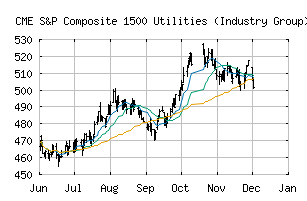
S&P Composite 1500 Utilities (Industry Group) (CME:SP1500-5510)
Strong Uptrend (+100) - SP1500-5510 is in a strong uptrend that is likely to continue. With short-term, intermediate, and long-term bullish momentum, SP1500-5510 continues to climb. Traders should protect gains and look for a change in score to suggest a slow down in momentum.
Is it time to buy, sell, or avoid SP1500-5510?
MarketClub looks at technical strength and momentum to determine if the timing is right for SP1500-5510.
Learn more about the Trade Triangles and how we make technical analysis as easy as buy and sell.
|
|||||||||||||||
|
|||||||||||||||
MarketClub’s Trade Triangles for SP1500-5510
![]() The long-term trend has been UP since Dec 13th, 2023 at 372.22
The long-term trend has been UP since Dec 13th, 2023 at 372.22
![]() The intermediate-term trend has been UP since Apr 23rd, 2024 at 380.51
The intermediate-term trend has been UP since Apr 23rd, 2024 at 380.51
![]() The short-term trend has been UP since Apr 19th, 2024 at 371.26
The short-term trend has been UP since Apr 19th, 2024 at 371.26
Smart Scan Analysis for SP1500-5510
Based on our trend formula, SP1500-5510 is rated as a +100 on a scale from -100 (Strong Downtrend) to +100 (Strong Uptrend).
| Open | High | Low | Price | Change |
|---|---|---|---|---|
| 399.57 | 404.29 | 398.67 | 404.04 | +3.87 |
| Prev. Close | Volume | Bid | Ask | Time |
| 404.04 | 145378569 | 2024-05-08 17:00:40 |
| 52wk High | 330.87 | 52wk High Date | 2017-12-01 |
| 52wk Low | 277.17 | 52wk Low Date | 2018-02-06 |