Index Trend Analysis Report
Prepared for you on Thursday, May 9, 2024.
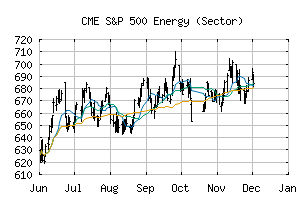
S&P 500 Energy (Sector) (CME:SP500-10)
Sidelines Mode (+55) - SP500-10 is moving in a sideways pattern and is unable to gain momentum in either direction. Beware of choppy movement and consider a sidelines position until a stronger trend is identified.
Is it time to buy, sell, or avoid SP500-10?
MarketClub looks at technical strength and momentum to determine if the timing is right for SP500-10.
Learn more about the Trade Triangles and how we make technical analysis as easy as buy and sell.
|
|||||||||||||||
|
|||||||||||||||
MarketClub’s Trade Triangles for SP500-10
![]() The long-term trend has been UP since Mar 1st, 2024 at 659.93
The long-term trend has been UP since Mar 1st, 2024 at 659.93
![]() The intermediate-term trend has been DOWN since Apr 30th, 2024 at 714.54
The intermediate-term trend has been DOWN since Apr 30th, 2024 at 714.54
![]() The short-term trend has been UP since May 6th, 2024 at 715.70
The short-term trend has been UP since May 6th, 2024 at 715.70
Smart Scan Analysis for SP500-10
Based on our trend formula, SP500-10 is rated as a +55 on a scale from -100 (Strong Downtrend) to +100 (Strong Uptrend).
| Open | High | Low | Price | Change |
|---|---|---|---|---|
| 711.43 | 720.10 | 711.43 | 720.10 | +9.37 |
| Prev. Close | Volume | Bid | Ask | Time |
| 710.73 | 59459607 | 2024-05-09 15:20:48 |
| 52wk High | 583.43 | 52wk High Date | 2018-05-22 |
| 52wk Low | 466.92 | 52wk Low Date | 2018-11-23 |