Index Trend Analysis Report
Prepared for you on Thursday, May 9, 2024.
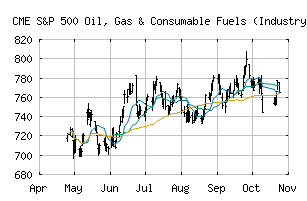
S&P 500 Oil, Gas & Consumable Fuels (Industry) (CME:SP500-101020)
Sidelines Mode (+55) - SP500-101020 is moving in a sideways pattern and is unable to gain momentum in either direction. Beware of choppy movement and consider a sidelines position until a stronger trend is identified.
Is it time to buy, sell, or avoid SP500-101020?
MarketClub looks at technical strength and momentum to determine if the timing is right for SP500-101020.
Learn more about the Trade Triangles and how we make technical analysis as easy as buy and sell.
|
|||||||||||||||
|
|||||||||||||||
MarketClub’s Trade Triangles for SP500-101020
![]() The long-term trend has been UP since Mar 1st, 2024 at 740.94
The long-term trend has been UP since Mar 1st, 2024 at 740.94
![]() The intermediate-term trend has been DOWN since May 1st, 2024 at 805.25
The intermediate-term trend has been DOWN since May 1st, 2024 at 805.25
![]() The short-term trend has been UP since May 6th, 2024 at 808.66
The short-term trend has been UP since May 6th, 2024 at 808.66
Smart Scan Analysis for SP500-101020
Based on our trend formula, SP500-101020 is rated as a +55 on a scale from -100 (Strong Downtrend) to +100 (Strong Uptrend).
| Open | High | Low | Price | Change |
|---|---|---|---|---|
| 799.90 | 806.87 | 798.56 | 803.11 | -0.63 |
| Prev. Close | Volume | Bid | Ask | Time |
| 803.11 | 101668897 | 2024-05-08 17:00:39 |
| 52wk High | 622.61 | 52wk High Date | 2018-10-09 |
| 52wk Low | 498.8 | 52wk Low Date | 2018-02-09 |