Index Trend Analysis Report
Prepared for you on Thursday, May 9, 2024.
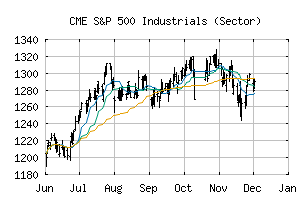
S&P 500 Industrials (Sector) (CME:SP500-20)
Bull Market Weakness (+75) - SP500-20 is showing signs of short-term weakness, but still remains in the confines of a long-term uptrend. Keep an eye on SP500-20 as it may be in the beginning stages of a reversal.
Is it time to buy, sell, or avoid SP500-20?
MarketClub looks at technical strength and momentum to determine if the timing is right for SP500-20.
Learn more about the Trade Triangles and how we make technical analysis as easy as buy and sell.
|
|||||||||||||||
|
|||||||||||||||
MarketClub’s Trade Triangles for SP500-20
![]() The long-term trend has been UP since Dec 6th, 2023 at 920.41
The long-term trend has been UP since Dec 6th, 2023 at 920.41
![]() The intermediate-term trend has been DOWN since Apr 15th, 2024 at 1036.08
The intermediate-term trend has been DOWN since Apr 15th, 2024 at 1036.08
![]() The short-term trend has been UP since May 6th, 2024 at 1041.61
The short-term trend has been UP since May 6th, 2024 at 1041.61
Smart Scan Analysis for SP500-20
Based on our trend formula, SP500-20 is rated as a +75 on a scale from -100 (Strong Downtrend) to +100 (Strong Uptrend).
| Open | High | Low | Price | Change |
|---|---|---|---|---|
| 1045.59 | 1053.36 | 1045.05 | 1052.27 | +0.29 |
| Prev. Close | Volume | Bid | Ask | Time |
| 1052.27 | 243787926 | 2024-05-08 17:00:39 |
| 52wk High | 680.89 | 52wk High Date | 2018-01-29 |
| 52wk Low | 563.06 | 52wk Low Date | 2018-10-29 |