Index Trend Analysis Report
Prepared for you on Thursday, May 9, 2024.
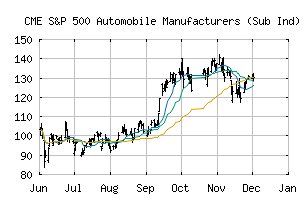
S&P 500 Automobile Manufacturers (Sub Ind) (CME:SP500-25102010)
Sidelines Mode (-55) - SP500-25102010 is moving in a sideways pattern and is unable to gain momentum in either direction. Beware of choppy movement and consider a sidelines position until a stronger trend is identified.
Is it time to buy, sell, or avoid SP500-25102010?
MarketClub looks at technical strength and momentum to determine if the timing is right for SP500-25102010.
Learn more about the Trade Triangles and how we make technical analysis as easy as buy and sell.
|
|||||||||||||||
|
|||||||||||||||
MarketClub’s Trade Triangles for SP500-25102010
![]() The long-term trend has been DOWN since Oct 20th, 2023 at 65.86
The long-term trend has been DOWN since Oct 20th, 2023 at 65.86
![]() The intermediate-term trend has been UP since Apr 29th, 2024 at 59.06
The intermediate-term trend has been UP since Apr 29th, 2024 at 59.06
![]() The short-term trend has been DOWN since May 8th, 2024 at 58.13
The short-term trend has been DOWN since May 8th, 2024 at 58.13
Smart Scan Analysis for SP500-25102010
Based on our trend formula, SP500-25102010 is rated as a -55 on a scale from -100 (Strong Downtrend) to +100 (Strong Uptrend).
| Open | High | Low | Price | Change |
|---|---|---|---|---|
| 57.46 | 57.56 | 56.53 | 56.58 | -0.81 |
| Prev. Close | Volume | Bid | Ask | Time |
| 57.39 | 85816552 | 2024-05-09 15:39:49 |
| 52wk High | 89.77 | 52wk High Date | 2018-01-16 |
| 52wk Low | 57.56 | 52wk Low Date | 2018-10-24 |