Index Trend Analysis Report
Prepared for you on Thursday, May 9, 2024.
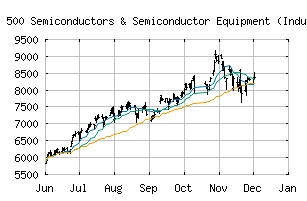
S&P 500 Semiconductors & Semiconductor Equipment (Industry Group) (CME:SP500-4530)
Bull Market Weakness (+75) - SP500-4530 is showing signs of short-term weakness, but still remains in the confines of a long-term uptrend. Keep an eye on SP500-4530 as it may be in the beginning stages of a reversal.
Is it time to buy, sell, or avoid SP500-4530?
MarketClub looks at technical strength and momentum to determine if the timing is right for SP500-4530.
Learn more about the Trade Triangles and how we make technical analysis as easy as buy and sell.
|
|||||||||||||||
|
|||||||||||||||
MarketClub’s Trade Triangles for SP500-4530
![]() The long-term trend has been UP since Nov 14th, 2023 at 2987.62
The long-term trend has been UP since Nov 14th, 2023 at 2987.62
![]() The intermediate-term trend has been UP since May 6th, 2024 at 4535.82
The intermediate-term trend has been UP since May 6th, 2024 at 4535.82
![]() The short-term trend has been DOWN since May 9th, 2024 at 4425.56
The short-term trend has been DOWN since May 9th, 2024 at 4425.56
Smart Scan Analysis for SP500-4530
Based on our trend formula, SP500-4530 is rated as a +75 on a scale from -100 (Strong Downtrend) to +100 (Strong Uptrend).
| Open | High | Low | Price | Change |
|---|---|---|---|---|
| 4489.98 | 4500.49 | 4418.37 | 4419.85 | -68.54 |
| Prev. Close | Volume | Bid | Ask | Time |
| 4488.39 | 35422219 | 2024-05-09 10:19:08 |
| 52wk High | 1095.24 | 52wk High Date | 2018-06-07 |
| 52wk Low | 826.22 | 52wk Low Date | 2018-11-20 |