Index Trend Analysis Report
Prepared for you on Thursday, May 9, 2024.
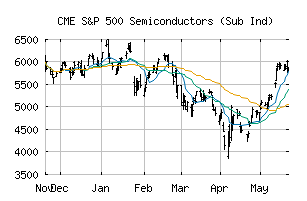
S&P 500 Semiconductors (Sub Ind) (CME:SP500-45301020)
Countertrend Up (+85) - SP500-45301020 is showing short-term weakness. However, look for the longer-term bullish trend to resume. As always, continue to monitor the trend score and utilize a stop order.
Is it time to buy, sell, or avoid SP500-45301020?
MarketClub looks at technical strength and momentum to determine if the timing is right for SP500-45301020.
Learn more about the Trade Triangles and how we make technical analysis as easy as buy and sell.
|
|||||||||||||||
|
|||||||||||||||
MarketClub’s Trade Triangles for SP500-45301020
![]() The long-term trend has been UP since Nov 14th, 2023 at 2888.12
The long-term trend has been UP since Nov 14th, 2023 at 2888.12
![]() The intermediate-term trend has been UP since May 6th, 2024 at 4471.14
The intermediate-term trend has been UP since May 6th, 2024 at 4471.14
![]() The short-term trend has been DOWN since May 9th, 2024 at 4368.06
The short-term trend has been DOWN since May 9th, 2024 at 4368.06
Smart Scan Analysis for SP500-45301020
Based on our trend formula, SP500-45301020 is rated as a +85 on a scale from -100 (Strong Downtrend) to +100 (Strong Uptrend).
| Open | High | Low | Price | Change |
|---|---|---|---|---|
| 4432.19 | 4443.92 | 4352.67 | 4394.04 | -37.28 |
| Prev. Close | Volume | Bid | Ask | Time |
| 4431.32 | 77958817 | 2024-05-09 12:49:23 |
| 52wk High | 1076.14 | 52wk High Date | 2018-06-07 |
| 52wk Low | 817.88 | 52wk Low Date | 2018-11-20 |