Index Trend Analysis Report
Prepared for you on Thursday, May 9, 2024.
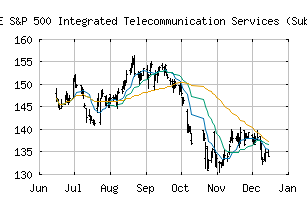
S&P 500 Integrated Telecommunication Services (Sub Ind) (CME:SP500-50101020)
Bull Market Weakness (+75) - SP500-50101020 is showing signs of short-term weakness, but still remains in the confines of a long-term uptrend. Keep an eye on SP500-50101020 as it may be in the beginning stages of a reversal.
Is it time to buy, sell, or avoid SP500-50101020?
MarketClub looks at technical strength and momentum to determine if the timing is right for SP500-50101020.
Learn more about the Trade Triangles and how we make technical analysis as easy as buy and sell.
|
|||||||||||||||
|
|||||||||||||||
MarketClub’s Trade Triangles for SP500-50101020
![]() The long-term trend has been UP since Nov 1st, 2023 at 100.26
The long-term trend has been UP since Nov 1st, 2023 at 100.26
![]() The intermediate-term trend has been DOWN since Apr 10th, 2024 at 111.06
The intermediate-term trend has been DOWN since Apr 10th, 2024 at 111.06
![]() The short-term trend has been UP since May 7th, 2024 at 111.52
The short-term trend has been UP since May 7th, 2024 at 111.52
Smart Scan Analysis for SP500-50101020
Based on our trend formula, SP500-50101020 is rated as a +75 on a scale from -100 (Strong Downtrend) to +100 (Strong Uptrend).
| Open | High | Low | Price | Change |
|---|---|---|---|---|
| 111.91 | 112.34 | 111.59 | 112.19 | +0.31 |
| Prev. Close | Volume | Bid | Ask | Time |
| 111.88 | 12683978 | 2024-05-09 12:50:53 |
| 52wk High | 177.02 | 52wk High Date | 2018-02-01 |
| 52wk Low | 145.38 | 52wk Low Date | 2018-05-09 |