Index Trend Analysis Report
Prepared for you on Thursday, April 25, 2024.
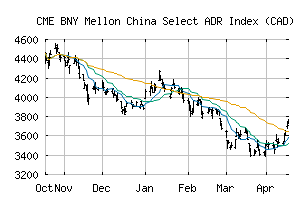
BNY Mellon China Select ADR Index (CAD) (CME:BKCNC)
Weak Uptrend (+65) - BKCNC is showing signs of weakening momentum to the upside. Monitor BKCNC as it may be in the beginning stages of a reversal.
Is it time to buy, sell, or avoid BKCNC?
MarketClub looks at technical strength and momentum to determine if the timing is right for BKCNC.
Learn more about the Trade Triangles and how we make technical analysis as easy as buy and sell.
|
|||||||||||||||
|
|||||||||||||||
MarketClub’s Trade Triangles for BKCNC
![]() The long-term trend has been UP since Mar 13th, 2024 at 3100.31
The long-term trend has been UP since Mar 13th, 2024 at 3100.31
![]() The intermediate-term trend has been DOWN since Apr 12th, 2024 at 2852.11
The intermediate-term trend has been DOWN since Apr 12th, 2024 at 2852.11
![]() The short-term trend has been UP since Apr 22nd, 2024 at 2827.32
The short-term trend has been UP since Apr 22nd, 2024 at 2827.32
Smart Scan Analysis for BKCNC
Based on our trend formula, BKCNC is rated as a +65 on a scale from -100 (Strong Downtrend) to +100 (Strong Uptrend).
| Open | High | Low | Price | Change |
|---|---|---|---|---|
| 2923.31 | 2950.18 | 2922.23 | 2935.10 | -14.93 |
| Prev. Close | Volume | Bid | Ask | Time |
| 2950.03 | 0 | 2024-04-25 10:52:17 |
| 52wk High | 5506.03 | 52wk High Date | 2018-06-12 |
| 52wk Low | 3774.76 | 52wk Low Date | 2018-10-29 |