Index Trend Analysis Report
Prepared for you on Friday, April 26, 2024.
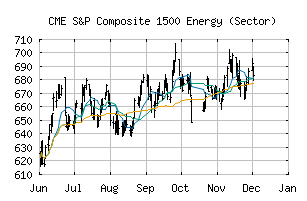
S&P Composite 1500 Energy (Sector) (CME:SP1500-10)
Bull Market Weakness (+75) - SP1500-10 is showing signs of short-term weakness, but still remains in the confines of a long-term uptrend. Keep an eye on SP1500-10 as it may be in the beginning stages of a reversal.
Is it time to buy, sell, or avoid SP1500-10?
MarketClub looks at technical strength and momentum to determine if the timing is right for SP1500-10.
Learn more about the Trade Triangles and how we make technical analysis as easy as buy and sell.
|
|||||||||||||||
|
|||||||||||||||
MarketClub’s Trade Triangles for SP1500-10
![]() The long-term trend has been UP since Mar 1st, 2024 at 659.77
The long-term trend has been UP since Mar 1st, 2024 at 659.77
![]() The intermediate-term trend has been UP since Jan 30th, 2024 at 643.40
The intermediate-term trend has been UP since Jan 30th, 2024 at 643.40
![]() The short-term trend has been UP since Apr 19th, 2024 at 729.46
The short-term trend has been UP since Apr 19th, 2024 at 729.46
Smart Scan Analysis for SP1500-10
Based on our trend formula, SP1500-10 is rated as a +70 on a scale from -100 (Strong Downtrend) to +100 (Strong Uptrend).
| Open | High | Low | Price | Change |
|---|---|---|---|---|
| 731.53 | 735.22 | 724.96 | 732.60 | -6.41 |
| Prev. Close | Volume | Bid | Ask | Time |
| 739.01 | 228613465 | 2024-04-26 16:19:49 |
| 52wk High | 603.42 | 52wk High Date | 2018-05-22 |
| 52wk Low | 477.65 | 52wk Low Date | 2018-11-23 |