Index Trend Analysis Report
Prepared for you on Tuesday, April 23, 2024.
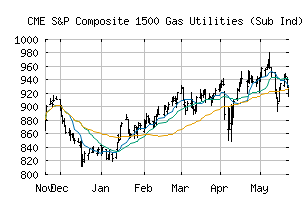
S&P Composite 1500 Gas Utilities (Sub Ind) (CME:SP1500-55102010)
Long-Term Uptrend (+90) - SP1500-55102010 is in a strong uptrend that is likely to continue. While SP1500-55102010 is showing intraday weakness, it remains in the confines of a bullish trend. Traders should use caution and utilize a stop order.
Is it time to buy, sell, or avoid SP1500-55102010?
MarketClub looks at technical strength and momentum to determine if the timing is right for SP1500-55102010.
Learn more about the Trade Triangles and how we make technical analysis as easy as buy and sell.
|
|||||||||||||||
|
|||||||||||||||
MarketClub’s Trade Triangles for SP1500-55102010
![]() The long-term trend has been UP since Jan 3rd, 2024 at 737.26
The long-term trend has been UP since Jan 3rd, 2024 at 737.26
![]() The intermediate-term trend has been UP since Apr 22nd, 2024 at 743.14
The intermediate-term trend has been UP since Apr 22nd, 2024 at 743.14
![]() The short-term trend has been UP since Apr 19th, 2024 at 720.04
The short-term trend has been UP since Apr 19th, 2024 at 720.04
Smart Scan Analysis for SP1500-55102010
Based on our trend formula, SP1500-55102010 is rated as a +90 on a scale from -100 (Strong Downtrend) to +100 (Strong Uptrend).
| Open | High | Low | Price | Change |
|---|---|---|---|---|
| 739.29 | 746.60 | 739.24 | 742.07 | -0.53 |
| Prev. Close | Volume | Bid | Ask | Time |
| 742.60 | 4623268 | 2024-04-23 16:19:27 |
| 52wk High | 881.73 | 52wk High Date | 2018-11-20 |
| 52wk Low | 685.79 | 52wk Low Date | 2018-02-06 |