Index Trend Analysis Report
Prepared for you on Tuesday, April 23, 2024.
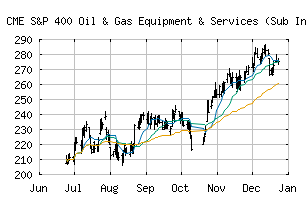
S&P 400 Oil & Gas Equipment & Services (Sub Ind) (CME:SP400-10101020)
Weak Downtrend (-65) - SP400-10101020 is showing signs of a strengthening downtrend. Monitor SP400-10101020 as it may be building momentum to the downside.
Is it time to buy, sell, or avoid SP400-10101020?
MarketClub looks at technical strength and momentum to determine if the timing is right for SP400-10101020.
Learn more about the Trade Triangles and how we make technical analysis as easy as buy and sell.
|
|||||||||||||||
|
|||||||||||||||
MarketClub’s Trade Triangles for SP400-10101020
![]() The long-term trend has been UP since Mar 13th, 2024 at 339.16
The long-term trend has been UP since Mar 13th, 2024 at 339.16
![]() The intermediate-term trend has been DOWN since Apr 16th, 2024 at 354.61
The intermediate-term trend has been DOWN since Apr 16th, 2024 at 354.61
![]() The short-term trend has been DOWN since Apr 9th, 2024 at 380.12
The short-term trend has been DOWN since Apr 9th, 2024 at 380.12
Smart Scan Analysis for SP400-10101020
Based on our trend formula, SP400-10101020 is rated as a -70 on a scale from -100 (Strong Downtrend) to +100 (Strong Uptrend).
| Open | High | Low | Price | Change |
|---|---|---|---|---|
| 350.89 | 351.33 | 349.44 | 351.33 | -1.38 |
| Prev. Close | Volume | Bid | Ask | Time |
| 352.71 | 107736 | 2024-04-23 09:39:39 |
| 52wk High | 626.57 | 52wk High Date | 2018-05-22 |
| 52wk Low | 375.67 | 52wk Low Date | 2018-11-28 |