Index Trend Analysis Report
Prepared for you on Friday, April 19, 2024.
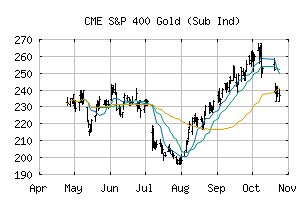
S&P 400 Gold (Sub Ind) (CME:SP400-15104030)
Long-Term Uptrend (+90) - SP400-15104030 is in a strong uptrend that is likely to continue. While SP400-15104030 is showing intraday weakness, it remains in the confines of a bullish trend. Traders should use caution and utilize a stop order.
Is it time to buy, sell, or avoid SP400-15104030?
MarketClub looks at technical strength and momentum to determine if the timing is right for SP400-15104030.
Learn more about the Trade Triangles and how we make technical analysis as easy as buy and sell.
|
|||||||||||||||
|
|||||||||||||||
MarketClub’s Trade Triangles for SP400-15104030
![]() The long-term trend has been UP since Apr 5th, 2024 at 162.68
The long-term trend has been UP since Apr 5th, 2024 at 162.68
![]() The intermediate-term trend has been UP since Mar 6th, 2024 at 146.64
The intermediate-term trend has been UP since Mar 6th, 2024 at 146.64
![]() The short-term trend has been UP since Apr 18th, 2024 at 160.26
The short-term trend has been UP since Apr 18th, 2024 at 160.26
Smart Scan Analysis for SP400-15104030
Based on our trend formula, SP400-15104030 is rated as a +90 on a scale from -100 (Strong Downtrend) to +100 (Strong Uptrend).
| Open | High | Low | Price | Change |
|---|---|---|---|---|
| 158.39 | 160.69 | 157.79 | 159.39 | +1.39 |
| Prev. Close | Volume | Bid | Ask | Time |
| 158.00 | 463601 | 2024-04-19 16:20:05 |
| 52wk High | 125.84 | 52wk High Date | 2018-07-05 |
| 52wk Low | 91.12 | 52wk Low Date | 2018-11-13 |