Index Trend Analysis Report
Prepared for you on Friday, April 19, 2024.
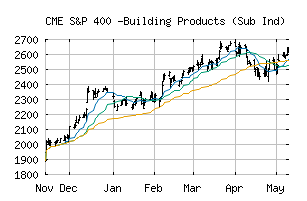
S&P 400 -Building Products (Sub Ind) (CME:SP400-20102010)
Crossroads (-60) - SP400-20102010 is struggling to move into a solid trend. Beware of choppy markets and consider a sidelines position until a stronger trend is identified.
Is it time to buy, sell, or avoid SP400-20102010?
MarketClub looks at technical strength and momentum to determine if the timing is right for SP400-20102010.
Learn more about the Trade Triangles and how we make technical analysis as easy as buy and sell.
|
|||||||||||||||
|
|||||||||||||||
MarketClub’s Trade Triangles for SP400-20102010
![]() The long-term trend has been UP since Dec 1st, 2023 at 2107.03
The long-term trend has been UP since Dec 1st, 2023 at 2107.03
![]() The intermediate-term trend has been DOWN since Apr 12th, 2024 at 2525.97
The intermediate-term trend has been DOWN since Apr 12th, 2024 at 2525.97
![]() The short-term trend has been DOWN since Apr 2nd, 2024 at 2633.19
The short-term trend has been DOWN since Apr 2nd, 2024 at 2633.19
Smart Scan Analysis for SP400-20102010
Based on our trend formula, SP400-20102010 is rated as a -60 on a scale from -100 (Strong Downtrend) to +100 (Strong Uptrend).
| Open | High | Low | Price | Change |
|---|---|---|---|---|
| 2450.35 | 2476.70 | 2433.31 | 2452.21 | -1.67 |
| Prev. Close | Volume | Bid | Ask | Time |
| 2453.88 | 3777325 | 2024-04-19 16:20:05 |
| 52wk High | 894.18 | 52wk High Date | 2018-09-13 |
| 52wk Low | 689.6 | 52wk Low Date | 2018-10-22 |