Index Trend Analysis Report
Prepared for you on Friday, April 19, 2024.
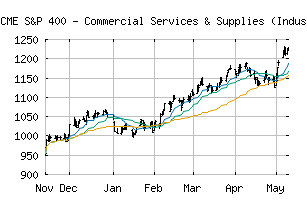
S&P 400 - Commercial Services & Supplies (Industry) (CME:SP400-202010)
Weak Downtrend (-65) - SP400-202010 is showing signs of a strengthening downtrend. Monitor SP400-202010 as it may be building momentum to the downside.
Is it time to buy, sell, or avoid SP400-202010?
MarketClub looks at technical strength and momentum to determine if the timing is right for SP400-202010.
Learn more about the Trade Triangles and how we make technical analysis as easy as buy and sell.
|
|||||||||||||||
|
|||||||||||||||
MarketClub’s Trade Triangles for SP400-202010
![]() The long-term trend has been UP since Dec 1st, 2023 at 1025.93
The long-term trend has been UP since Dec 1st, 2023 at 1025.93
![]() The intermediate-term trend has been DOWN since Apr 16th, 2024 at 1141.83
The intermediate-term trend has been DOWN since Apr 16th, 2024 at 1141.83
![]() The short-term trend has been DOWN since Apr 11th, 2024 at 1165.87
The short-term trend has been DOWN since Apr 11th, 2024 at 1165.87
Smart Scan Analysis for SP400-202010
Based on our trend formula, SP400-202010 is rated as a -70 on a scale from -100 (Strong Downtrend) to +100 (Strong Uptrend).
| Open | High | Low | Price | Change |
|---|---|---|---|---|
| 1134.16 | 1141.36 | 1130.57 | 1132.71 | +1.53 |
| Prev. Close | Volume | Bid | Ask | Time |
| 1131.18 | 385915 | 2024-04-19 12:45:20 |
| 52wk High | 893.82 | 52wk High Date | 2018-09-21 |
| 52wk Low | 735.13 | 52wk Low Date | 2018-02-09 |