Index Trend Analysis Report
Prepared for you on Friday, April 26, 2024.
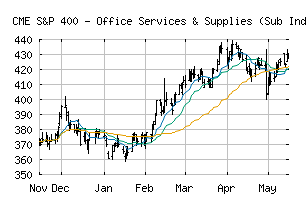
S&P 400 - Office Services & Supplies (Sub Ind) (CME:SP400-20201060)
Sidelines Mode (-55) - SP400-20201060 is moving in a sideways pattern and is unable to gain momentum in either direction. Beware of choppy movement and consider a sidelines position until a stronger trend is identified.
Is it time to buy, sell, or avoid SP400-20201060?
MarketClub looks at technical strength and momentum to determine if the timing is right for SP400-20201060.
Learn more about the Trade Triangles and how we make technical analysis as easy as buy and sell.
|
|||||||||||||||
|
|||||||||||||||
MarketClub’s Trade Triangles for SP400-20201060
![]() The long-term trend has been UP since Feb 15th, 2024 at 402.01
The long-term trend has been UP since Feb 15th, 2024 at 402.01
![]() The intermediate-term trend has been DOWN since Apr 16th, 2024 at 418.74
The intermediate-term trend has been DOWN since Apr 16th, 2024 at 418.74
![]() The short-term trend has been UP since Apr 22nd, 2024 at 423.87
The short-term trend has been UP since Apr 22nd, 2024 at 423.87
Smart Scan Analysis for SP400-20201060
Based on our trend formula, SP400-20201060 is rated as a -55 on a scale from -100 (Strong Downtrend) to +100 (Strong Uptrend).
| Open | High | Low | Price | Change |
|---|---|---|---|---|
| 423.60 | 427.19 | 422.37 | 422.95 | +0.15 |
| Prev. Close | Volume | Bid | Ask | Time |
| 422.80 | 99772 | 2024-04-26 16:19:50 |
| 52wk High | 357.16 | 52wk High Date | 2018-01-31 |
| 52wk Low | 292.25 | 52wk Low Date | 2018-05-04 |